Biggest Global Banks 2026: Insane Asset Sizes and What It Means for Finance
In 2026, just 50 global banks control more than 100 trillion dollars in assets, with Chinese state‑owned lenders at the top and a small group of U.S., European, and Japanese giants shaping how money moves around the world. This extreme concentration of financial power is transforming not only markets and governments, but also jobs, credit access, and how fast—or how safely—the global economy can grow.
The Insane Asset Wall: Who Sits on Top
Updated rankings for 2026 based on total assets show that the world’s biggest banks form a very tight “asset wall.” Total assets here include loans, securities, cash, interbank claims, and trading books—essentially the full size of a bank’s balance sheet.
At the very top of this wall are the Chinese “Big Four”:
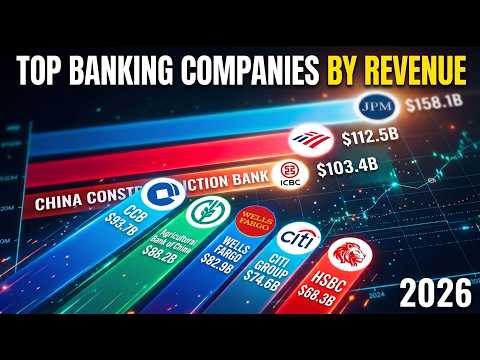
Industrial and Commercial Bank of China (ICBC) – around 7.3 trillion USD in assets, the largest bank on earth for the 13th straight year.
Agricultural Bank of China – roughly 6.7–6.8 trillion USD in assets, heavily focused on agriculture, rural areas, and infrastructure.
China Construction Bank (CCB) – about 6.2 trillion USD in assets, a core financier of housing and large infrastructure projects.
Bank of China (BOC) – around 5.2–5.3 trillion USD in assets, the most globally oriented of the four, with strong trade‑finance and cross‑border operations.
They are followed by a handful of Western and Japanese megabanks:
JPMorgan Chase (U.S.) – around 4.5 trillion USD in assets, the largest bank in the West and often ranked #1 in the world by market capitalization and overall corporate strength.
Bank of America (U.S.) – roughly 3.4 trillion USD in assets, a universal bank with deep retail and corporate franchises.
BNP Paribas (France) – about 3.3 trillion USD in assets, the biggest bank in the euro area.
HSBC (UK) – roughly 3.2 trillion USD in assets, UK‑domiciled but highly focused on Asia, especially Hong Kong and mainland China.
Mitsubishi UFJ Financial Group – MUFG (Japan) – around 2.7 trillion USD in assets, Japan’s largest bank and a key wholesale funder across Asia.
Crédit Agricole (France) – approximately 2.7–2.8 trillion USD in assets, a cooperative‑rooted universal bank with strong retail and corporate reach.
Across the top 50, combined assets reach about 101.6 trillion USD, almost matching the world’s entire public‑debt stock. Chinese banks alone account for around 39–40% of that total, with 13 Chinese names in the top‑50 ranking.
Why Chinese Banks Dominate the Asset Rankings
S&P Global’s 2026 ranking of the world’s 100 largest banks confirms that Chinese banks again drive overall asset growth, while U.S. banks saw a slight contraction. Total assets of the top 100 grew about 1.7%, propelled by a 5.2% increase from Chinese lenders that offset a 2.1% decline among U.S. institutions.
This dominance is not an accident. It reflects structural features of China’s model:
High savings, bank‑centric system: Chinese households and firms channel most savings into bank deposits, giving megabanks a huge funding base.
State‑directed development: The government uses large state‑owned banks to implement policy—funding infrastructure, heavy industry, and real estate at scale.
Rapid nominal growth: Decades of high nominal GDP growth compounded assets faster than in slower‑growing advanced economies.
Positively, this has financed highways, ports, railways, power plants, and urban housing on a scale unmatched by any other country, supporting millions of jobs and lifting hundreds of millions of people out of poverty. Negatively, it has created deep exposures to a slowing property sector, indebted local governments, and politically driven projects that may not be commercially viable.
U.S. Giants: Smaller Balance Sheets, Huge Market Power
By assets, U.S. banks are smaller than the Chinese Big Four, but rankings based on market capitalization, profits, and capital‑markets reach tell a different story.
JPMorgan Chase:
Tops the Forbes Global 2000 list of banks and financial firms in 2026, reflecting its unmatched earnings and diversified business model.
Posted a record Q2 2026 profit, with revenue up across all major lines—consumer banking, corporate lending, markets and investment banking—highlighting its earnings power.
Operates massive global payments, custody, and securities‑services platforms that move trillions in flows daily, giving it outsized influence over funding costs, liquidity, and market functioning.
Bank of America, Citigroup and others remain crucial for U.S. credit creation and global dollar markets, even if they rank slightly lower than Chinese banks by assets.
In practice, that means: Chinese banks dominate scale, while U.S. banks dominate profitability, market value and capital‑market infrastructure.
Europe and Japan: Systemically Important but Fragmented
Europe and Japan still anchor a big share of the global banking system but in a more fragmented way.
Europe has nearly as many banks in the top‑50 as Asia, but with smaller average size—about 1.6 trillion USD in assets vs. Asia’s 2.6 trillion.
France (BNP Paribas, Crédit Agricole), the UK (HSBC, Barclays), Spain (Santander, BBVA), Germany (Deutsche Bank), Switzerland (UBS), the Netherlands (ING), Italy (Intesa Sanpaolo, UniCredit) all appear in the top‑50 rankings.
Japan contributes MUFG, SMFG, Mizuho and Japan Post Bank, which are heavy on balance‑sheet size and play major roles in regional funding and carry trades.
These institutions:
Finance Europe’s industrial base—automotive, aerospace, machinery, agriculture—and large infrastructure projects.
Provide critical euro, sterling and yen funding to corporates, governments, and emerging markets.
But they also struggle with low structural growth, thin margins, and the costs of ongoing restructuring and digital transformation, which constrain lending capacity and can lead to branch closures and job cuts.
What These Asset Sizes Mean for the Real Economy
For workers, companies, and governments, these “insane” asset sizes translate directly into real‑world effects.
Positive contributions:
Jobs and investment: By funding infrastructure, factories, logistics networks, and technology projects, big banks help create and sustain millions of jobs in construction, manufacturing, transport, and services.
Trade and supply chains: Trade‑finance lines, letters of credit and FX services offered by global banks keep goods and commodities moving, reducing risk for exporters and importers.
Household finance and inclusion: Mortgages, consumer loans, and savings products offered at scale support home ownership, education, and small‑business formation, especially when combined with digital banking that reaches remote or underserved areas.
Negative and mixed outcomes:
Pro‑cyclical lending: In boom periods, aggressive lending—especially into real estate—can fuel bubbles; when cycles turn, tightening credit can deepen recessions and accelerate layoffs.
Unequal bargaining power: Large, well‑rated corporates get the best terms, while SMEs and lower‑income households often face higher costs or are excluded, even as headline profits at the top banks reach records.
Externalities and ESG gaps: Financing of fossil fuels, heavy industry, and weakly governed projects can cause pollution, social displacement, and long‑term climate risks that are not fully internalized by the banks providing the capital.
So the same balance sheets that build bridges and wind farms can also fund coal plants or speculative towers that sit half‑empty.
Systemic Risk: When “Insane Size” Becomes a Vulnerability
With asset sizes this large, the biggest global banks are inherently systemically important.
S&P Global emphasizes growing divergence: Chinese banks grew assets by more than 5% while U.S. banks shrank slightly, and yet both sets of institutions are tightly interconnected through funding, derivatives and cross‑border exposures. Central banks and regulators classify many of them as global systemically important banks (G‑SIBs), which means:
Higher capital and liquidity requirements.
Regular, severe stress testing.
Detailed “living wills” for resolution in a crisis.
Benefits: these tools make large banks more resilient and, in theory, reduce the need for taxpayer bailouts.
Risks that remain:
Markets still expect authorities to rescue the very biggest players, creating moral hazard.
A shock in one part of the system—such as China’s property sector or U.S. commercial real estate—can quickly propagate through funding and derivatives channels, because the same few institutions sit at the center of most major markets.
In other words, size enhances diversification but also amplifies the potential impact of bad decisions or mispriced risks.
ESG, Climate Finance and “Green” Legitimacy
In 2026, all major banks talk about sustainability, and many have set multi‑trillion‑dollar sustainable‑finance commitments. They underwrite green bonds, finance renewable energy, and support projects in low‑carbon transport and energy‑efficient buildings. Done right, this can:
Accelerate decarbonization and climate resilience.
Create new jobs in clean‑energy and green‑infrastructure sectors.
But watchdogs and NGOs highlight major gaps:
Many of the same banks remain among the largest financiers of fossil‑fuel companies and carbon‑intensive industries, which undercuts their climate claims.
Some “sustainable” products rely on weak definitions or offset schemes, raising accusations of greenwashing when marketing outpaces real portfolio change.
For a post targeting strong “green” legitimacy, the key is to recognize both sides: the potential of mega‑banks to fund a just transition at scale and the need for credible, measurable shifts in their core lending—not just PR.
Digitalization and Data: Power + New Risks
The biggest global banks are also racing to digitize their business:
S&P Global and industry commentary highlight how institutions are moving from AI “experiments” to full‑scale deployment, using generative AI and cloud‑based tools to modernize legacy systems and cut costs.
This boosts efficiency, speeds up credit decisions, enhances fraud detection, and helps build personalized products delivered via apps and online platforms.
For the real economy, that can mean faster loan approvals, better risk pricing, and more accessible services for SMEs and households.
However, the combination of massive data concentration plus AI introduces new systemic concerns:
Privacy and surveillance worries as banks combine financial data with behavioral and location data.
Algorithmic bias that can reinforce discrimination in credit scoring or pricing.
Cyber‑security risk: a major breach or outage at one top‑tier bank could disrupt payments, markets and trade flows across multiple countries within hours.
What These Insane Asset Sizes Really Mean for Finance
Taken together, the 2026 numbers tell a clear story:
A small group of roughly 50 institutions controls over 100 trillion USD in assets.
Chinese state‑owned banks dominate by balance‑sheet size and asset growth; U.S. banks lead in market value, earnings and capital‑markets muscle; European and Japanese banks remain indispensable regional anchors.
These “insane” asset sizes make the biggest banks both essential for financing growth, jobs and climate transition, and dangerous if mismanaged, poorly regulated or driven solely by short‑term profit.
For finance and society, the key issue is not whether mega‑banks are big—they already are—but how they use that scale:
Do they channel capital into productive, sustainable, inclusive activities?
Or do they amplify cycles, entrench inequalities, and delay the shift away from polluting, high‑risk business models?
In 2026, the biggest global banks sit at the heart of that choice. Their balance sheets are large enough to move entire sectors and countries; whether they move them toward resilience and shared prosperity—or toward more concentrated, fragile, and unequal outcomes—will define what these “insane” asset sizes really mean for global finance and for everyday life.